Times Table Chart
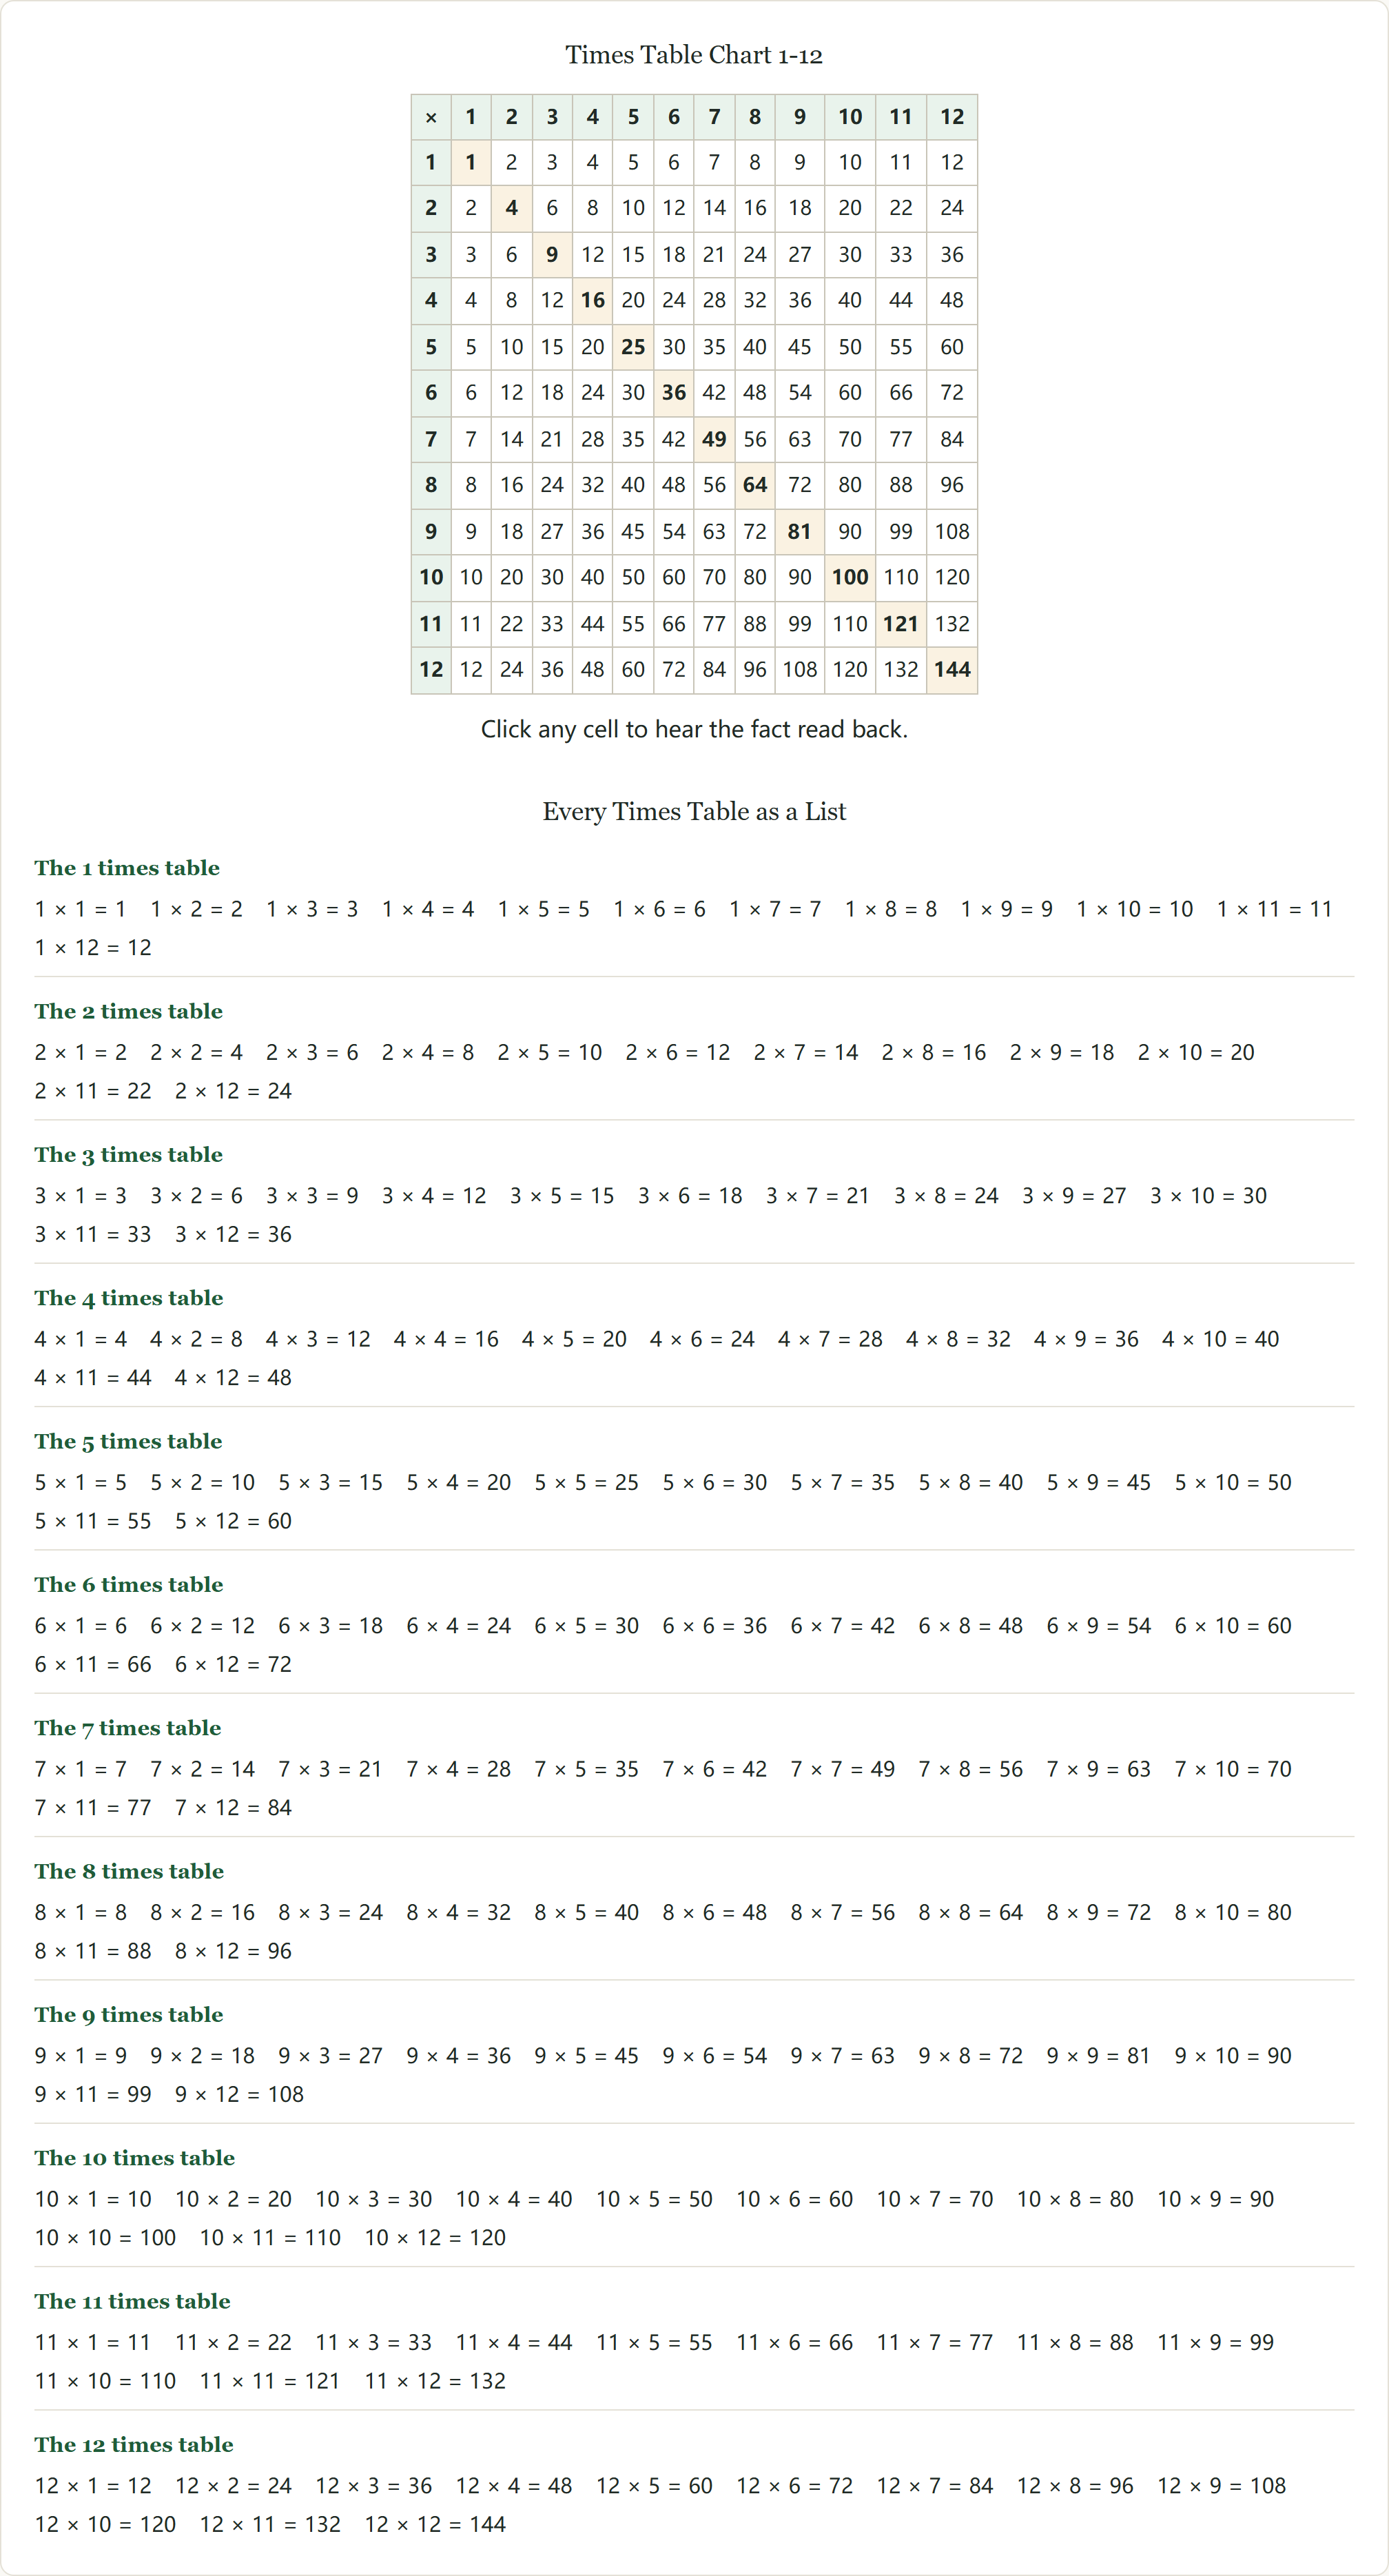
The full 1-12 times table chart, free to print, in two layouts: the grid everyone knows, and each times table written out as its own list of facts. Same 144 answers, two ways to read them — plus the order teachers actually introduce the tables in, and how skip counting does the early work.
Times Table Chart 1-12
| × | 1 | 2 | 3 | 4 | 5 | 6 | 7 | 8 | 9 | 10 | 11 | 12 |
|---|---|---|---|---|---|---|---|---|---|---|---|---|
| 1 | 1 | 2 | 3 | 4 | 5 | 6 | 7 | 8 | 9 | 10 | 11 | 12 |
| 2 | 2 | 4 | 6 | 8 | 10 | 12 | 14 | 16 | 18 | 20 | 22 | 24 |
| 3 | 3 | 6 | 9 | 12 | 15 | 18 | 21 | 24 | 27 | 30 | 33 | 36 |
| 4 | 4 | 8 | 12 | 16 | 20 | 24 | 28 | 32 | 36 | 40 | 44 | 48 |
| 5 | 5 | 10 | 15 | 20 | 25 | 30 | 35 | 40 | 45 | 50 | 55 | 60 |
| 6 | 6 | 12 | 18 | 24 | 30 | 36 | 42 | 48 | 54 | 60 | 66 | 72 |
| 7 | 7 | 14 | 21 | 28 | 35 | 42 | 49 | 56 | 63 | 70 | 77 | 84 |
| 8 | 8 | 16 | 24 | 32 | 40 | 48 | 56 | 64 | 72 | 80 | 88 | 96 |
| 9 | 9 | 18 | 27 | 36 | 45 | 54 | 63 | 72 | 81 | 90 | 99 | 108 |
| 10 | 10 | 20 | 30 | 40 | 50 | 60 | 70 | 80 | 90 | 100 | 110 | 120 |
| 11 | 11 | 22 | 33 | 44 | 55 | 66 | 77 | 88 | 99 | 110 | 121 | 132 |
| 12 | 12 | 24 | 36 | 48 | 60 | 72 | 84 | 96 | 108 | 120 | 132 | 144 |
Click any cell to hear the fact read back.
Every Times Table as a List
The 1 times table
1 × 1 = 11 × 2 = 21 × 3 = 31 × 4 = 41 × 5 = 51 × 6 = 61 × 7 = 71 × 8 = 81 × 9 = 91 × 10 = 101 × 11 = 111 × 12 = 12
The 2 times table
2 × 1 = 22 × 2 = 42 × 3 = 62 × 4 = 82 × 5 = 102 × 6 = 122 × 7 = 142 × 8 = 162 × 9 = 182 × 10 = 202 × 11 = 222 × 12 = 24
The 3 times table
3 × 1 = 33 × 2 = 63 × 3 = 93 × 4 = 123 × 5 = 153 × 6 = 183 × 7 = 213 × 8 = 243 × 9 = 273 × 10 = 303 × 11 = 333 × 12 = 36
The 4 times table
4 × 1 = 44 × 2 = 84 × 3 = 124 × 4 = 164 × 5 = 204 × 6 = 244 × 7 = 284 × 8 = 324 × 9 = 364 × 10 = 404 × 11 = 444 × 12 = 48
The 5 times table
5 × 1 = 55 × 2 = 105 × 3 = 155 × 4 = 205 × 5 = 255 × 6 = 305 × 7 = 355 × 8 = 405 × 9 = 455 × 10 = 505 × 11 = 555 × 12 = 60
The 6 times table
6 × 1 = 66 × 2 = 126 × 3 = 186 × 4 = 246 × 5 = 306 × 6 = 366 × 7 = 426 × 8 = 486 × 9 = 546 × 10 = 606 × 11 = 666 × 12 = 72
The 7 times table
7 × 1 = 77 × 2 = 147 × 3 = 217 × 4 = 287 × 5 = 357 × 6 = 427 × 7 = 497 × 8 = 567 × 9 = 637 × 10 = 707 × 11 = 777 × 12 = 84
The 8 times table
8 × 1 = 88 × 2 = 168 × 3 = 248 × 4 = 328 × 5 = 408 × 6 = 488 × 7 = 568 × 8 = 648 × 9 = 728 × 10 = 808 × 11 = 888 × 12 = 96
The 9 times table
9 × 1 = 99 × 2 = 189 × 3 = 279 × 4 = 369 × 5 = 459 × 6 = 549 × 7 = 639 × 8 = 729 × 9 = 819 × 10 = 909 × 11 = 999 × 12 = 108
The 10 times table
10 × 1 = 1010 × 2 = 2010 × 3 = 3010 × 4 = 4010 × 5 = 5010 × 6 = 6010 × 7 = 7010 × 8 = 8010 × 9 = 9010 × 10 = 10010 × 11 = 11010 × 12 = 120
The 11 times table
11 × 1 = 1111 × 2 = 2211 × 3 = 3311 × 4 = 4411 × 5 = 5511 × 6 = 6611 × 7 = 7711 × 8 = 8811 × 9 = 9911 × 10 = 11011 × 11 = 12111 × 12 = 132
The 12 times table
12 × 1 = 1212 × 2 = 2412 × 3 = 3612 × 4 = 4812 × 5 = 6012 × 6 = 7212 × 7 = 8412 × 8 = 9612 × 9 = 10812 × 10 = 12012 × 11 = 13212 × 12 = 144
PNG version — the exact file Download PNG saves
The order kids actually learn the times tables
Times tables are not learned counting up from 1 to 12. Nearly every curriculum starts with the 2s, 5s and 10s, because those rows show patterns you can see: doubles, endings that flip between 5 and 0, a zero bolted onto the other factor. Next come the 3s and 4s, usually through skip-counting songs and short daily chants. The 6s, 7s and 8s are the hard middle — most kids build them from facts they already know, so 6 × 8 becomes 5 × 8 plus one more 8. The 9s, 11s and 12s land last and easiest: the 9s carry the finger trick and the digits-add-to-9 pattern, the 11s read themselves almost to 9 × 11, and the 12s are just a 10 and a 2 stuck together.
Skip counting is the engine underneath all of it. A times table is skip counting written down — the 4s row is exactly what you hear chanting 4, 8, 12, 16, 20. That is why the second sheet on this page lists each table as its own line: read down it as a chant, cover the answers, chant again. Coloring skip counts on a hundred chart is the same lesson a year earlier, and by third grade the standard asks for these products from memory — the chart is the map, the chants put on the miles.
Times table or multiplication chart — what is the difference?
Nothing, in the numbers. A times table chart and a multiplication chart show the same 1-12 grid with the same 144 products. “Times table” is the everyday phrase — what parents and kids say (“do you know your 7 times table?”) — while multiplication chart or multiplication table is the textbook term. British schools lean hard on times tables; England even runs a national on-screen times tables check at the end of Year 4. American teachers more often say multiplication facts or fact fluency, but US families search “times table chart” just as much — same tool, different dialect.
Use whichever word your kid uses; the job is identical: facts recalled without counting, well enough to free up attention for bigger problems. If your child reads a grid as a wall of numbers, hand them the list sheet first — one table at a time, in learning order, is a smaller door into the same room. When the lists feel easy, the grid becomes what it is meant to be: a place to look up the two or three facts that still slip.
Teaching tips
Start with the 2s, 5s and 10s
These three tables carry the clearest patterns, and finishing them early gives kids three known rows to lean on. The 10s also set up place value, money math and the 9s trick later.
Chant, cover, chant again
Read one table down the list sheet aloud twice, cover the answers with a sticky note, and chant it from memory. Uncover to check. Two minutes per table per day beats a half-hour worksheet on Saturday.
Build the hard ones from easy ones
Is 6 × 8 slippery? It is 5 × 8 (40) plus one more 8. Kids who learn to lean on facts they know stop guessing — and the 6s, 7s and 8s shrink from three scary rows to a handful of genuinely new facts.
Color the skip counts first
Before any drills, color the 2s, 5s and 10s on a hundred chart. Watching the columns light up makes skip counting visible — and it is the same skill that will carry the 3s and 4s.
Frequently asked questions
What is a times table chart?
A chart that shows all the times tables from 1 to 12 in one grid: row 7 meets column 8 at 7 × 8 = 56. Each row is one full table — the 7s row runs 7, 14, 21 on up to 84. It is the same thing as a multiplication chart.
Which times table should kids learn first?
The 2s, 5s and 10s — the friendliest patterns. Then the 3s and 4s through skip counting, then the 6s, 7s and 8s built from known facts, with the 9s, 11s and 12s last. Schools vary a little — some pull the 9s earlier because the patterns are so satisfying — but 2s, 5s and 10s first is close to universal.
How can my child memorize the times tables?
Short daily practice beats long sessions: chant one table down the list sheet, cover the answers, chant again, check. Follow with a blank chart to fill in, and move to the timed mad-minute drills on the multiplication chart page once recall is reliable. Most kids need a few weeks per table — that is normal, not a problem.
Is a times table chart the same as a multiplication chart?
Yes — same grid, same products. “Times table” is the spoken, everyday term; “multiplication chart” is the textbook term. British usage favors times tables (England tests them nationally in Year 4); American classrooms say both.
Why does this page have two layouts?
The grid is for looking facts up and spotting patterns — the symmetry, the perfect squares down the diagonal. The list sheet shows one table at a time, which chants well and suits kids who find grids busy. Same 144 facts either way; print the one that fits the kid, or both.
Is the times table chart free to print?
Free, no sign-up. Both sheets print on letter paper in black and white — the grid on page one, the table-by-table list on page two. Pick a single page in the print dialog if that is all you need.