Multiplication Chart Printable
One print job, three multiplication charts: the classic filled 1-12 grid, a blank copy for practice, and every times table written out line by line. It all prints as black lines on white letter paper — pick the pages you want in the print dialog and skip the rest.
Multiplication Chart 1-12 (Filled)
| × | 1 | 2 | 3 | 4 | 5 | 6 | 7 | 8 | 9 | 10 | 11 | 12 |
|---|---|---|---|---|---|---|---|---|---|---|---|---|
| 1 | 1 | 2 | 3 | 4 | 5 | 6 | 7 | 8 | 9 | 10 | 11 | 12 |
| 2 | 2 | 4 | 6 | 8 | 10 | 12 | 14 | 16 | 18 | 20 | 22 | 24 |
| 3 | 3 | 6 | 9 | 12 | 15 | 18 | 21 | 24 | 27 | 30 | 33 | 36 |
| 4 | 4 | 8 | 12 | 16 | 20 | 24 | 28 | 32 | 36 | 40 | 44 | 48 |
| 5 | 5 | 10 | 15 | 20 | 25 | 30 | 35 | 40 | 45 | 50 | 55 | 60 |
| 6 | 6 | 12 | 18 | 24 | 30 | 36 | 42 | 48 | 54 | 60 | 66 | 72 |
| 7 | 7 | 14 | 21 | 28 | 35 | 42 | 49 | 56 | 63 | 70 | 77 | 84 |
| 8 | 8 | 16 | 24 | 32 | 40 | 48 | 56 | 64 | 72 | 80 | 88 | 96 |
| 9 | 9 | 18 | 27 | 36 | 45 | 54 | 63 | 72 | 81 | 90 | 99 | 108 |
| 10 | 10 | 20 | 30 | 40 | 50 | 60 | 70 | 80 | 90 | 100 | 110 | 120 |
| 11 | 11 | 22 | 33 | 44 | 55 | 66 | 77 | 88 | 99 | 110 | 121 | 132 |
| 12 | 12 | 24 | 36 | 48 | 60 | 72 | 84 | 96 | 108 | 120 | 132 | 144 |
Click any cell to hear the fact read back.
Blank Multiplication Chart 1-12
| × | 1 | 2 | 3 | 4 | 5 | 6 | 7 | 8 | 9 | 10 | 11 | 12 |
|---|---|---|---|---|---|---|---|---|---|---|---|---|
| 1 | ||||||||||||
| 2 | ||||||||||||
| 3 | ||||||||||||
| 4 | ||||||||||||
| 5 | ||||||||||||
| 6 | ||||||||||||
| 7 | ||||||||||||
| 8 | ||||||||||||
| 9 | ||||||||||||
| 10 | ||||||||||||
| 11 | ||||||||||||
| 12 |
Every Times Table as a List
The 1 times table
1 × 1 = 11 × 2 = 21 × 3 = 31 × 4 = 41 × 5 = 51 × 6 = 61 × 7 = 71 × 8 = 81 × 9 = 91 × 10 = 101 × 11 = 111 × 12 = 12
The 2 times table
2 × 1 = 22 × 2 = 42 × 3 = 62 × 4 = 82 × 5 = 102 × 6 = 122 × 7 = 142 × 8 = 162 × 9 = 182 × 10 = 202 × 11 = 222 × 12 = 24
The 3 times table
3 × 1 = 33 × 2 = 63 × 3 = 93 × 4 = 123 × 5 = 153 × 6 = 183 × 7 = 213 × 8 = 243 × 9 = 273 × 10 = 303 × 11 = 333 × 12 = 36
The 4 times table
4 × 1 = 44 × 2 = 84 × 3 = 124 × 4 = 164 × 5 = 204 × 6 = 244 × 7 = 284 × 8 = 324 × 9 = 364 × 10 = 404 × 11 = 444 × 12 = 48
The 5 times table
5 × 1 = 55 × 2 = 105 × 3 = 155 × 4 = 205 × 5 = 255 × 6 = 305 × 7 = 355 × 8 = 405 × 9 = 455 × 10 = 505 × 11 = 555 × 12 = 60
The 6 times table
6 × 1 = 66 × 2 = 126 × 3 = 186 × 4 = 246 × 5 = 306 × 6 = 366 × 7 = 426 × 8 = 486 × 9 = 546 × 10 = 606 × 11 = 666 × 12 = 72
The 7 times table
7 × 1 = 77 × 2 = 147 × 3 = 217 × 4 = 287 × 5 = 357 × 6 = 427 × 7 = 497 × 8 = 567 × 9 = 637 × 10 = 707 × 11 = 777 × 12 = 84
The 8 times table
8 × 1 = 88 × 2 = 168 × 3 = 248 × 4 = 328 × 5 = 408 × 6 = 488 × 7 = 568 × 8 = 648 × 9 = 728 × 10 = 808 × 11 = 888 × 12 = 96
The 9 times table
9 × 1 = 99 × 2 = 189 × 3 = 279 × 4 = 369 × 5 = 459 × 6 = 549 × 7 = 639 × 8 = 729 × 9 = 819 × 10 = 909 × 11 = 999 × 12 = 108
The 10 times table
10 × 1 = 1010 × 2 = 2010 × 3 = 3010 × 4 = 4010 × 5 = 5010 × 6 = 6010 × 7 = 7010 × 8 = 8010 × 9 = 9010 × 10 = 10010 × 11 = 11010 × 12 = 120
The 11 times table
11 × 1 = 1111 × 2 = 2211 × 3 = 3311 × 4 = 4411 × 5 = 5511 × 6 = 6611 × 7 = 7711 × 8 = 8811 × 9 = 9911 × 10 = 11011 × 11 = 12111 × 12 = 132
The 12 times table
12 × 1 = 1212 × 2 = 2412 × 3 = 3612 × 4 = 4812 × 5 = 6012 × 6 = 7212 × 7 = 8412 × 8 = 9612 × 9 = 10812 × 10 = 12012 × 11 = 13212 × 12 = 144
PNG version — the exact file Download PNG saves
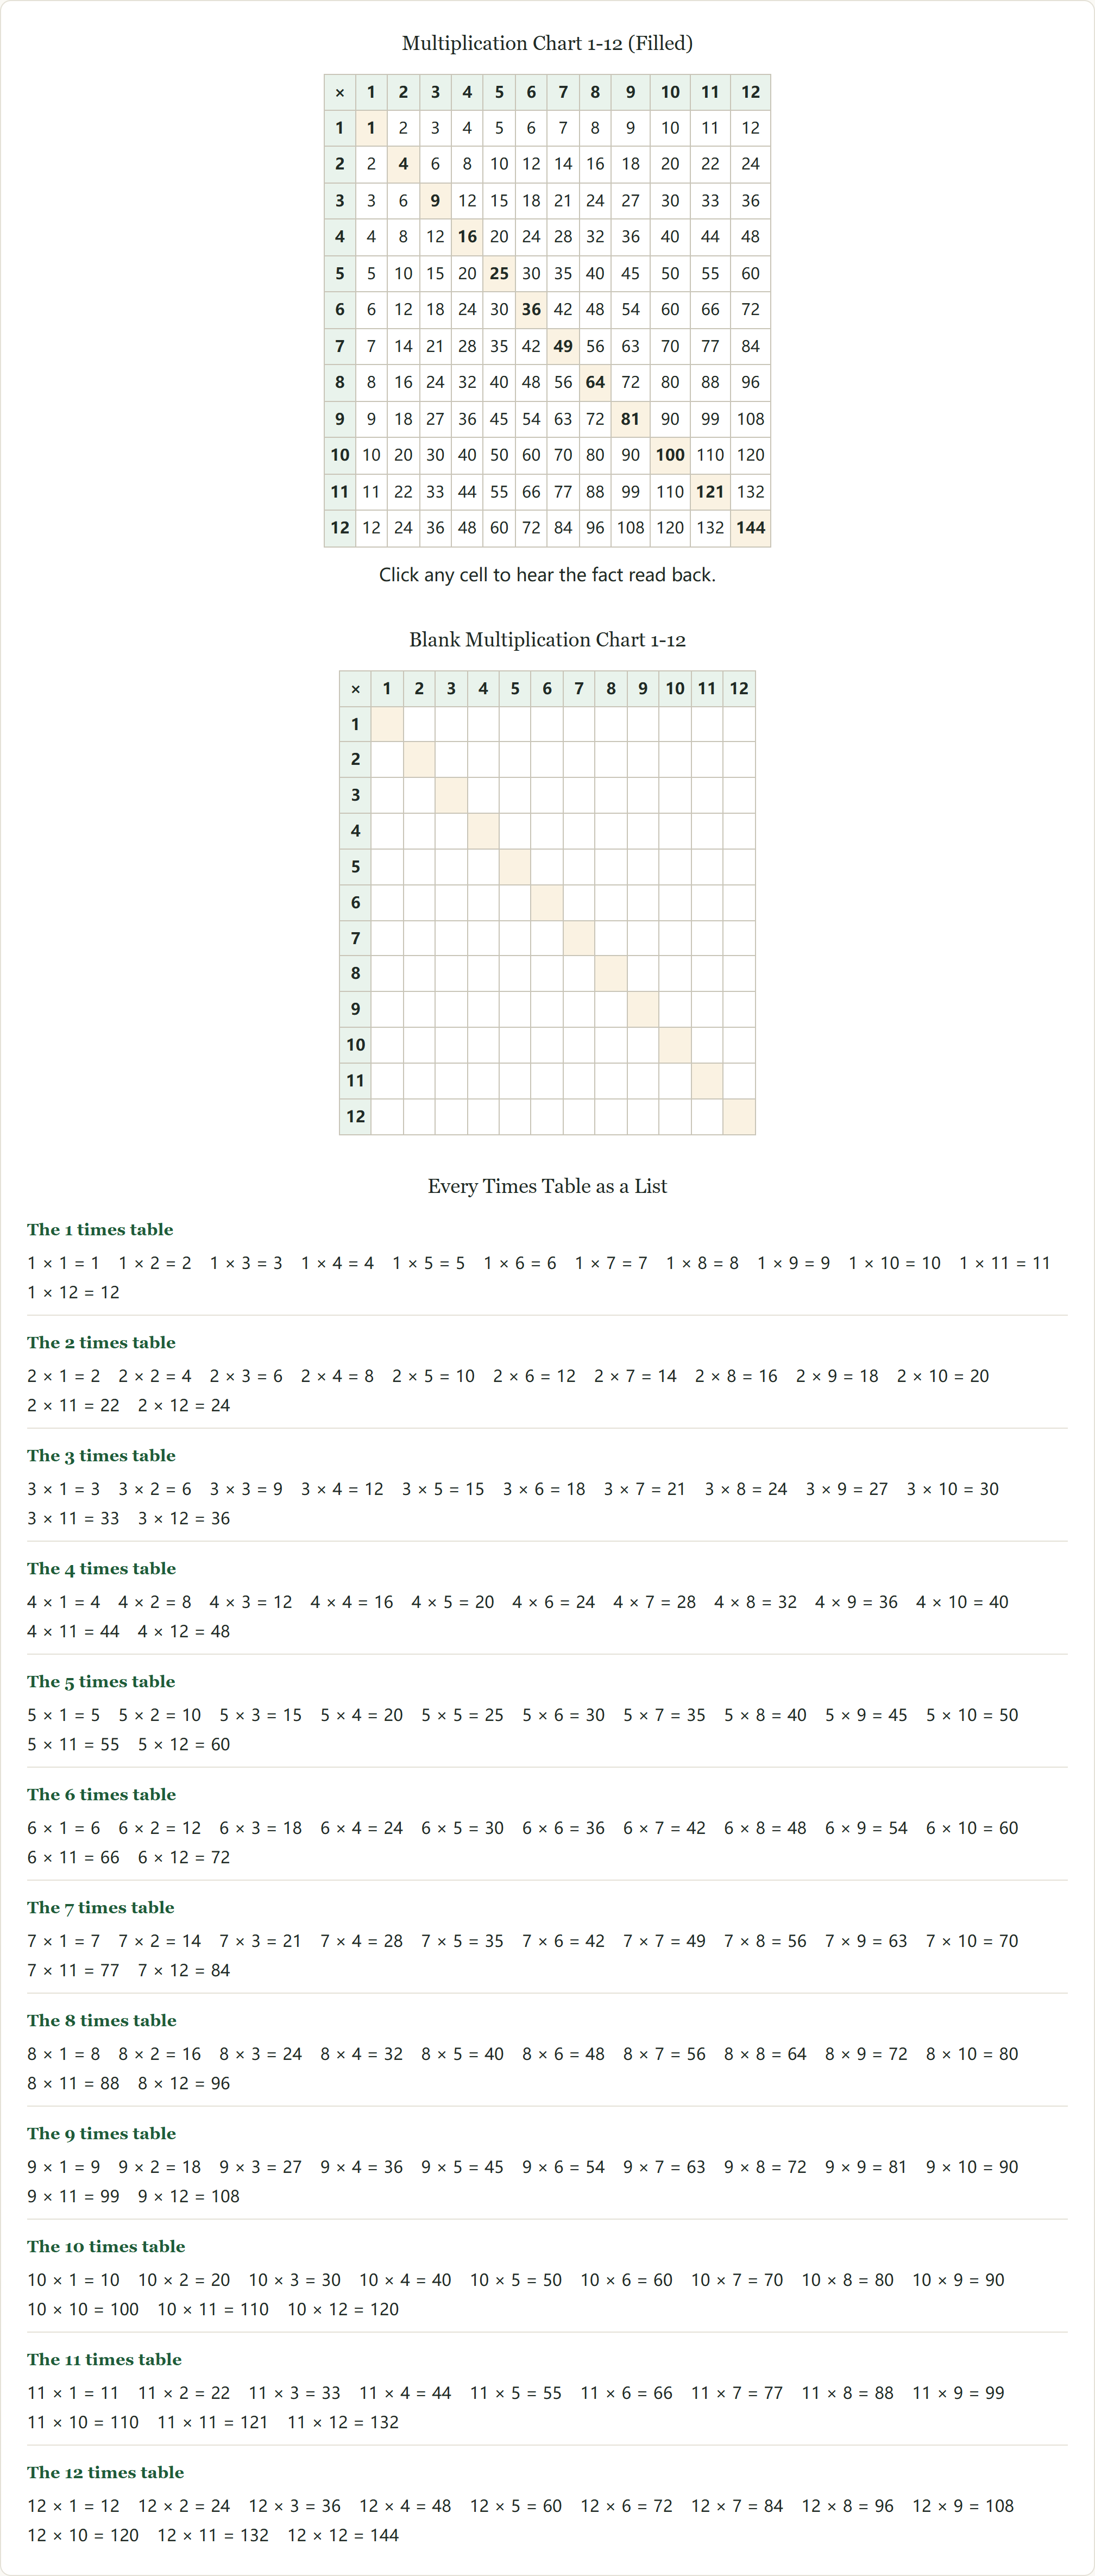
Three formats, one print job
The print button above sends three letter pages to your printer, portrait. Page one is the filled 1-12 chart with all 144 products, page two is the same grid with the answers removed, and page three lists each times table on its own line — the 4s run 4 × 1 = 4 straight through 4 × 12 = 48, then the 5s, all the way to the 12s. Everything prints as black lines on white: the green headers and shaded squares you see on screen are stripped at print time, so one black cartridge is all you need and draft mode is fine — these sheets are line work, not photos.
The 1-12 chart is the format to print because it is the format schools actually use. The Common Core fluency standard (3.OA.C.7) asks third graders to know every product of two one-digit numbers from memory — that is the 1-through-9 heart of the grid. Charts traditionally run through 12 because dozens still count: 12 hours on a clock, 12 inches in a foot, eggs by the dozen. A chart that stops at 10 leaves off facts kids meet outside worksheets; a chart that runs to 20 is a reference for older students, not a memorization map (the site has both — 1-15 and 1-20, linked below).
Each format does a different job. The filled chart is a reference: it hangs on the wall or lives in a binder while memory catches up. The blank chart is a workout — filling it in forces recall, and recall is what installs the facts; recognizing an answer is not the same as producing it. The list page is the bridge for kids who find grids busy: one table at a time, read down the line like a chant. Print the filled chart for the wall and a stack of blanks for practice — that pair covers a school year of fact work.
Teaching tips
Print page two by the handful
The blank chart is the consumable — print five now. A filled chart for reference plus a weekly blank to fill in is a complete fact program that fits in a folder.
Draft mode is fine here
These sheets are line work with no solid fills, so your printer’s draft or grayscale setting prints them cleanly and stretches the cartridge for months. Save the high-quality setting for the wall copy.
Chant down the list page
Cover the answers on a line with a sticky note and call it out — 4, 8, 12, 16 — then uncover to check. That is skip counting, and it is exactly how the 2s, 5s and 10s get learned first.
A4 paper works too
The sheets are sized for US letter, but nothing clips on A4 — the tables shrink slightly and stay readable. Same three pages, no printer settings to fight.
Frequently asked questions
Is this multiplication chart printable free?
Yes — free, no sign-up, no email, no watermark. The charts print straight from your browser; there is nothing to download first.
Can I get the multiplication chart as a PDF?
No download needed: in the print dialog, choose “Save as PDF” as the printer and you get a clean three-page PDF of exactly these sheets — one page per format, black lines on white. Works the same on Windows, Mac, Chrome and Safari.
What do the three printed pages include?
Page one is the filled 1-12 chart, page two is the blank 1-12 chart, and page three lists each times table as its own line of equations, 1s through 12s. Every page is portrait letter and stands alone — print any one of them.
Does the chart print in color or black and white?
Black and white only. The color you see on screen — green headers, shaded perfect squares — is dropped at print time, so the sheets use about as little ink as a page can. Photocopies come out clean too.
Should I print the filled chart or the blank one?
Both, for different jobs. The filled chart is for looking facts up — wall or binder. The blank chart is for practice, because producing an answer from memory strengthens it far more than reading it does. One filled on the wall, blanks by the dozen.
Why does the chart go to 12 instead of 10?
Third-grade fluency standards cover products of one-digit numbers — through 9 × 9. Charts run to 12 × 12 because 12s are everywhere outside the classroom: hours on a clock, inches in a foot, eggs in a carton. The 10s column ends the easy patterns; 11s and 12s close out the facts that workbooks still drill.